The Complete Guide to DIY Phone Case Vending Machine ROI in 2025 - GOBEAR
Master ROI calculation for DIY phone case vending machines. Complete 2025 guide covers investment costs, profit margins,...

I'm the COO of GOBEAR. We help entrepreneurs, mall operators, 3C mobile stores, event venues, and campus retailers tap into high-margin, low-maintenance vending models.
Most vending machines take 12 to 18 months to pay for themselves, but screen protector units operate on a faster timeline. Because you sell high-margin protection rather than low-margin snacks, break-even often drops to just 3 to 6 months.
The difference between a 90-day recovery and a slow year comes down to three factors: location traffic, automation efficiency, and avoiding hidden operational costs.
This guide analyzes real 2026 ROI data to help you calculate exactly when your machine will become profitable.
The formula for return on investment is simple in theory but volatile in practice. ROI hinges on balancing upfront equipment costs against daily foot traffic and operational overhead. External factors dictate how quickly gross revenue can cover the initial Capital Expenditure (CapEx) and start generating actual free cash flow.
Three primary levers determine this timeline:
Initial Capital Outlay: The total investment, including machine cost and installation, defines the baseline. A lower initial outlay or a machine with higher durability shortens the distance to the break-even point.
Daily Transaction Volume: Gross revenue correlates directly with pedestrian volume and conversion rates. High-traffic environments like shopping malls, universities, or transit hubs significantly elevate daily transaction potential compared to secondary locations.
Operational Expenses (OpEx): Recurring costs bleed profit margins. These include site rent, electricity, and the labor hours required for restocking. Keeping these low is essential for net profitability.
It is crucial to distinguish between generic vending, static inventory sales, and on-demand manufacturing. Standard vending typically requires 12 to 18 months to break even because it relies on selling low-cost commodities like snacks and drinks, where profit per unit is measured in cents.
In contrast, on-demand customization kiosks utilize premium margins to slash this timeline. Industry data indicates that while machines selling pre-packaged goods require a maturation period of 6 to 12 months, on-demand units can accelerate this significantly in prime locations by eliminating inventory risk.
|
Metric |
Standard Vending |
Pre-Packaged Screen Protectors |
On-Demand Customization Vending |
|---|---|---|---|
|
Average Payback Period |
12 to 18 Months |
6 to 12 Months |
1 to 3 Months |
|
Primary Margin Driver |
High Volume / Low Margin |
Moderate Volume / Medium Margin |
Premium Pricing / Custom Service |
|
Inventory Risk |
High |
Medium |
Zero |
|
Break-Even Volume |
Thousands of units |
~1,000+ units |
~638 Custom Units |
The relationship between transaction frequency and break-even speed is linear. Volume dictates velocity. When daily sales increase, the fixed costs of operation, such as location rent and electricity, are distributed across a larger number of units. This dilution effect means a higher percentage of every subsequent sale goes directly toward profit rather than covering overhead.
To visualize the math behind an accelerated payback, consider a standard $12,000 hardware investment with a target to sell approximately 638 total units.
The Danger Zone: Units selling fewer than 5 items daily struggle to cover monthly fixed maintenance and rent. At this pace, ROI extends beyond 12 months.
The Stability Zone: Maintaining a steady 10 to 15 sales per day recovers the investment in roughly 4 to 6 months.
The High-Performance Zone: This is where ROI accelerates. Operators maintaining around 21 daily sales allow for a break-even timeline of approximately 30 days.
Research indicates that implementing cashless systems is a key driver here. This technology increases transaction volume by approximately 35%, converting impulse interest into completed sales efficiently.
High-traffic locations dictate the speed of capital recovery, but "traffic" is not the same as "buyers." Operators in captive environments like shopping centers and universities report the fastest returns because the audience has dwell time. This differs from busy transit walkways where people are rushing to catch a train.
Data from 2026 operations highlights how volume directly translates to monthly net profit across different site types:
Shopping Malls: High-intent locations often average 20 daily sales, generating approximately $3,600 in monthly profit. The high conversion rate accelerates the payback period to under 4 months.
University Locations: Campus units frequently maintain steady revenue with $2,700 monthly profit based on 15 daily sales. The consistent semester traffic provides a predictable 5–6 month ROI.
Airport Terminals: Transport hubs see consistent volume, netting around $2,160 in monthly profit. While rent is higher, the volume sustains a 4–6 month recovery cycle.
A machine in a targeted location, like an office breakroom or tech hub, often achieves ROI faster than one in a busy but irrelevant walkway. The conversion rate from passersby to your customers is simply higher in these focused environments.
Spreadsheets often lie. A common pitfall in B2B vending is calculating ROI based solely on the machine cost versus the gross margin of the product. This "napkin math" looks attractive—showing margins of 60% or higher—but it fails to account for the Total Cost of Ownership (TCO).
If you do not factor in these friction costs, your breakeven point will slide from 6 months to 18 months without warning:
The "Zero Labor" Myth: While the machine is automated, "zero labor" refers to the sales process, not the business management. You must account for the cost of loading, driving, and troubleshooting. Even if you service the machines yourself, that time has a dollar value.
Location Rent & Commissions: Fixed overhead often includes liability insurance and property taxes. Furthermore, prime locations often demand a revenue share of 10% to 20% of gross sales, which directly reduces your net cash flow.
Cash Flow vs. Revenue: Top-line sales figures do not equal cash in the bank. Payment processing fees and transaction lags mean your actual liquidity is always lower than your dashboard revenue.
Real profitability depends on tracking these hidden variables, not just gross revenue.
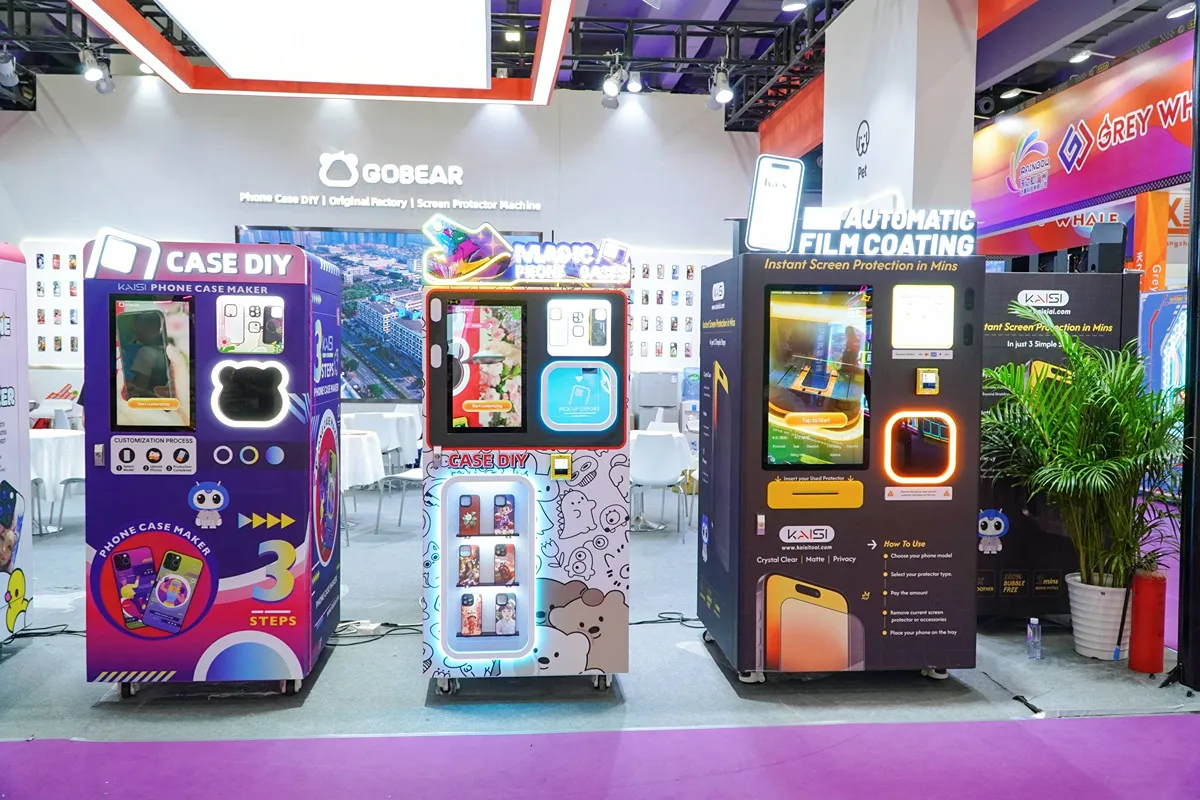
For operators seeking to maximize efficiency within the "On-Demand Customization" category, GOBEAR hardware, specifically the 108T screen protector vending machine, alters the standard financial equation by mitigating the hidden costs mentioned above. Internal operational data indicates that in high-traffic locations, these units can achieve average ROI significantly faster than industry norms due to three specific efficiency drivers.
Operational inefficiency is the silent killer of ROI. GOBEAR’s cloud-based dashboard eliminates the "black box" problem by giving you direct, live access to revenue streams and inventory levels.
Remote Monitoring: Eliminates "ghost runs" by tracking real-time sales and stock levels from any mobile device.
Proactive Alerts: The system notifies you instantly if maintenance is needed, ensuring technical failures do not eat into your 24/7 revenue hours.
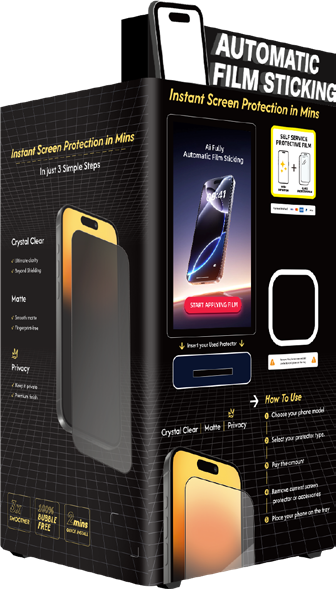
Speed defines your revenue ceiling in automated retail. In high-traffic zones, a slow interface creates a bottleneck. The GOBEAR 108T automates the entire application workflow in just 120 seconds. This includes model detection, film alignment, dust removal, and bubble-free installation. This speed ensures you capture maximum throughput during peak hours, supporting the volume needed for a <3 month ROI.
Profitability isn't just about sales volume; it's about controlling the cost of goods. The machine holds 5,400 units of universal consumable capacity. This means you stock blank films rather than thousands of pre-cut models. This eliminates the risk of holding obsolete inventory for old phone models and significantly reduces the capital tied up in warehousing.
Don't guess on profitability—verify it with your own data. To determine if a specific location will meet your ROI goals, use this simple calculation method.
Add your machine cost, shipping, installation fees, and initial stock deposit.
(Example: $12,000)
Subtract the cost of the blank film, payment processing fee, and location commission from your retail price.
(Example: Price $20 - Cost $2 - Fee $0.60 - Rent $4 = $13.40 Net Profit)
$12,000 / $13.40 = 895 Sales needed to break even.
At 10 sales/day = 89 Days
At 20 sales/day = 45 Days
Most operators see gross margins between 60% and 80%. Since the cost of raw film is low compared to the service price, your primary expense is location rent (often 10-20% of sales) rather than product cost.
Routine vending machine maintenance is minimal. Operators typically visit the machine once a week to refill blank films and clean the application area. Smart monitoring systems will alert you if an urgent technical issue arises.
Yes, but with caveats. While cloud management allows you to track sales and inventory from home, you still need a local team or partner to handle physical restocking and site cleaning. It is not 100% passive.
Yes. A targeted location with "high dwell time" users, like a university student center, often outperforms a busy subway station where people are rushing. You need customers with 2 minutes to spare.
Yes, card readers are essential. While fees typically range from 3% to 6% per transaction plus a monthly service charge (~$10), cashless machines see roughly 35% higher sales volume, which far outweighs the processing costs.
Waiting for a monthly P&L statement to fix a bleeding location is a rookie mistake. Instead, secure your investment with a data-backed strategy that prioritizes speed and efficiency. Contact us today to start your own profitable screen protector vending machine business.
Tell us about your business goals, and our experts will provide a tailored solution and a detailed profitability report. Let's start building your new revenue stream together.